← Tous les articles
Déployer et monitorer des agents — Logs, feedback loops et auto-amélioration
Garder les agents en bonne santé : monitoring temps réel, feedback loops, amélioration continue, incident response.
Le monitoring est critique
Un agent qui hallucine ou boucle infiniment = coûteux et risqué.
Quoi monitorer
1. Agent health
{
  "timestamp": "2026-08-25T10:00:00Z",
  "agent_id": "support-router-001",
  "request_id": "req_xyz",
  "status": "success|error|timeout",
  "tool_calls_count": 4,
  "iterations": 2,
  "tokens_used": 1200,
  "duration_ms": 3500,
  "final_action": "route_to_sales",
  "human_review_required": false,
  "error": null
}
2. Tool-level metrics
Tool: lookup_customer
  - Success rate : 98.5%
  - Avg latency : 200ms
  - Error types : [timeout (1%), invalid_input (0.5%)]

Tool: send_email
  - Success rate : 99.8%
  - Delivery rate : 99.7% (how many actually sent)
  - Bounces : 0.1%
3. User outcome metrics
Agent: support router
  - Requests/day : 2,500
  - Auto-resolved : 65%
  - Escalated : 25%
  - Error : 10%

  User satisfaction (post-interaction survey) :
  - "Did agent help ?" → 72% yes
  - "Would you use again ?" → 78% yes
Setup monitoring stack (minimal)
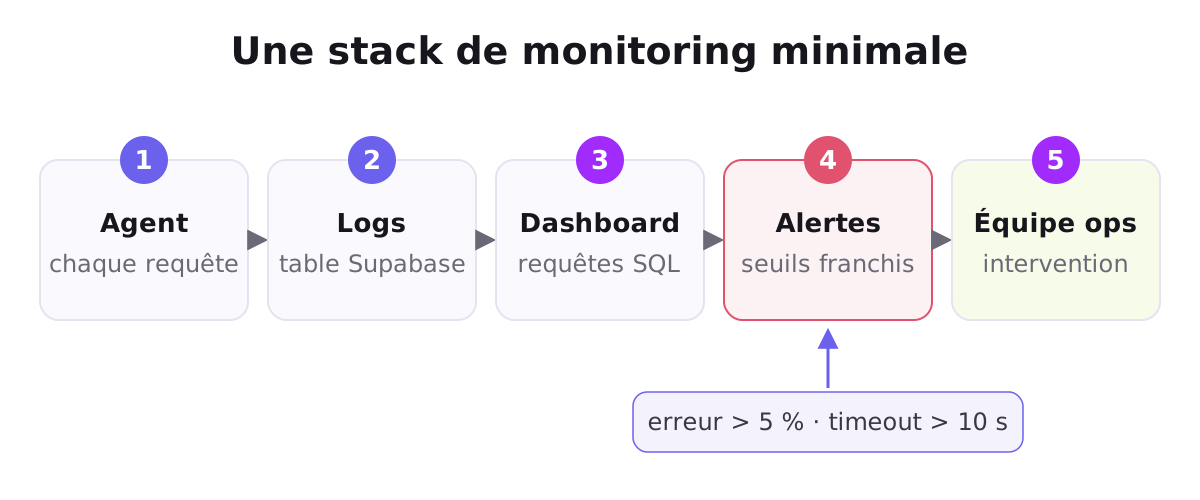
Agent runs
  ↓
Log to Supabase (table: agent_logs)
  ↓
Query logs (SQL) → Google Sheets/dashboard
  ↓
Alerts (if error > 5%, timeout > 10s)
  ↓
Escalate to ops team
Log schema (Supabase)
CREATE TABLE agent_logs (
  id UUID PRIMARY KEY,
  created_at TIMESTAMP,
  agent_id TEXT,
  request_id TEXT,
  status TEXT, -- success|error|timeout
  tool_calls JSONB, -- [{name, input, result, duration}]
  tokens_used INT,
  duration_ms INT,
  final_output TEXT,
  user_rating INT (1-5, optional),
  error TEXT,
  INDEX (agent_id, created_at),
  INDEX (status)
);
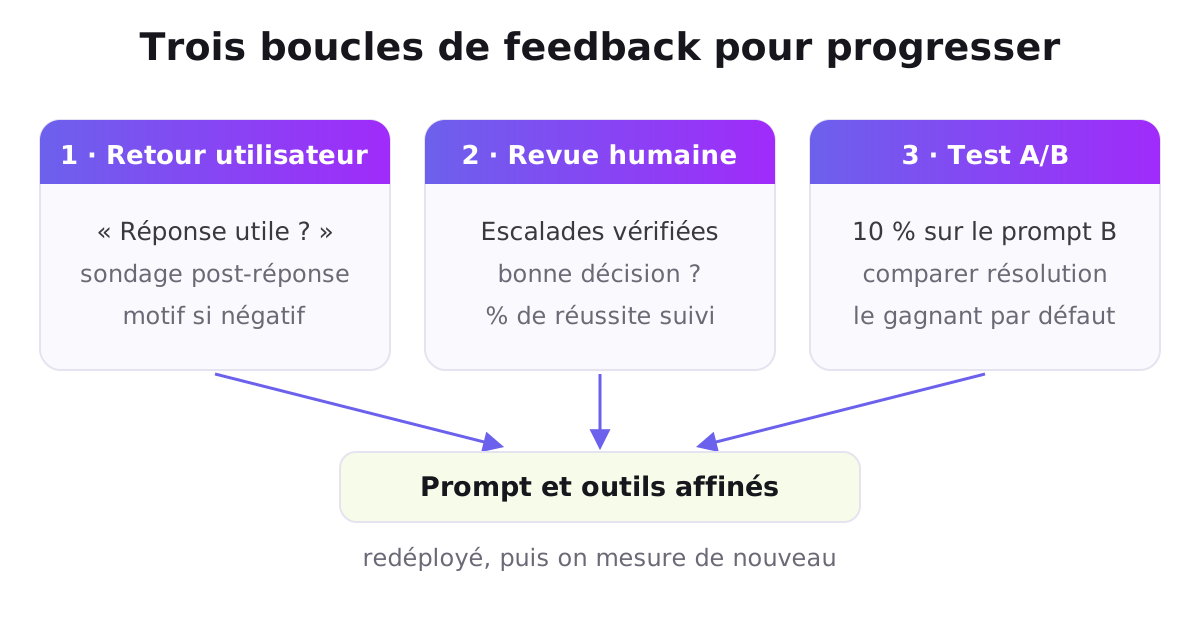
Feedback loops : Learning from failures
Loop 1 : User feedback
After agent completes :
  "Was this response helpful ?"
  [👍 Yes / 👎 No / 😐 Partial]

If 👎 :
  "What was wrong ?"
  [Select reason from list]

Log the feedback → Use to improve prompts
Loop 2 : Human reviews
Agent: "I will escalate to sales team"

Sales person receives + reviews:
  "Did agent make the right decision ?"
  [✓ Yes / ✗ No]

If ✗ : Log why → Refine agent prompt

Agg data : "60% of escalations were correct"
         → Agent performing well
         vs. "20% correct" → Need to retrain
Loop 3 : A/B testing
Deploy 2 agent versions :

Version A (default prompt)
Version B (new prompt with better context)

Route 10% to B, rest to A.

Compare :
  - Resolution rate
  - User satisfaction
  - Escalation rate

Winner becomes default.
Debugging : Finding why agent failed
Scenario 1 : Agent looped 20 times
Look at logs for request_id=xyz:
[
  iteration 1: tool=lookup_customer, result=OK
  iteration 2: tool=search_kb, result=OK
  iteration 3: tool=send_email, result=error "timeout"
  iteration 4-20: tool=send_email, result=error (retry)
  → After 20 retries, gave up
]

Root cause : send_email tool was down
Fix : Better error handling + max_retries limit
Scenario 2 : Agent hallucinated a tool
Log shows:
  Claude tried to call : "get_customer_sentiment()"
  But tool doesn't exist
  → Error : "Unknown tool"

Root cause : Tool definition was unclear or incomplete
Fix : Update tool definitions in system prompt
Scenario 3 : Wrong decision
Agent: "Escalate to billing"
Reality: Should have gone to technical support

Log shows agent output, but not why decision was made.
Fix : Add "reasoning" field to logs
  - What did agent consider ?
  - Why chose billing over tech ?
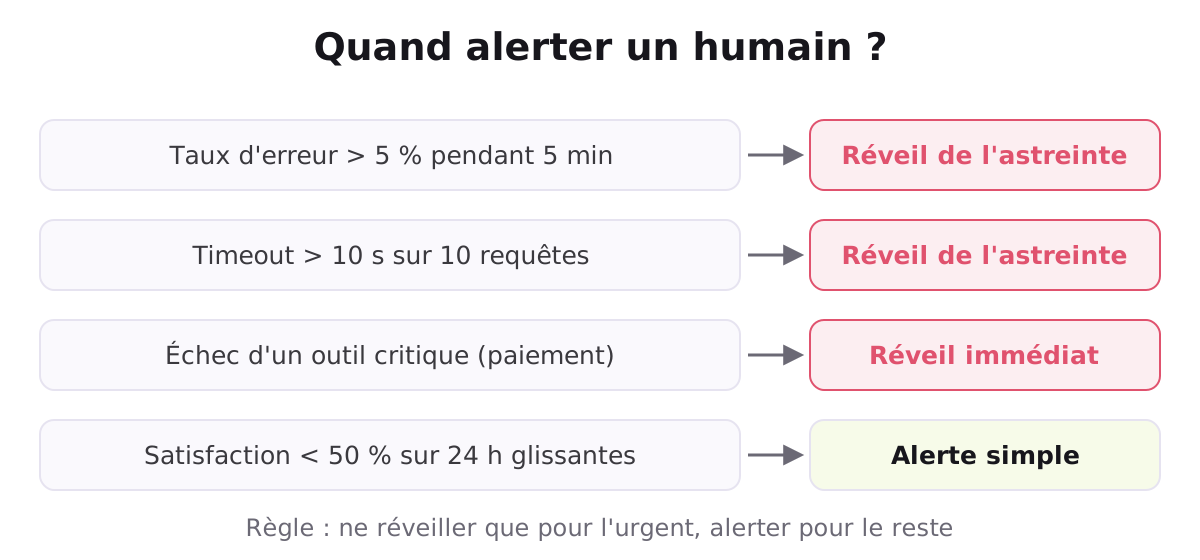
Alerts : When to page an engineer
Set alerts for :
IF agent_error_rate > 5% FOR 5 minutes → Page
IF agent_timeout > 10s FOR 10 requests → Page
IF specific_tool_failure (e.g., payment gateway) → Page immediately
IF user_satisfaction < 50% (rolling 24h) → Alert (not page)
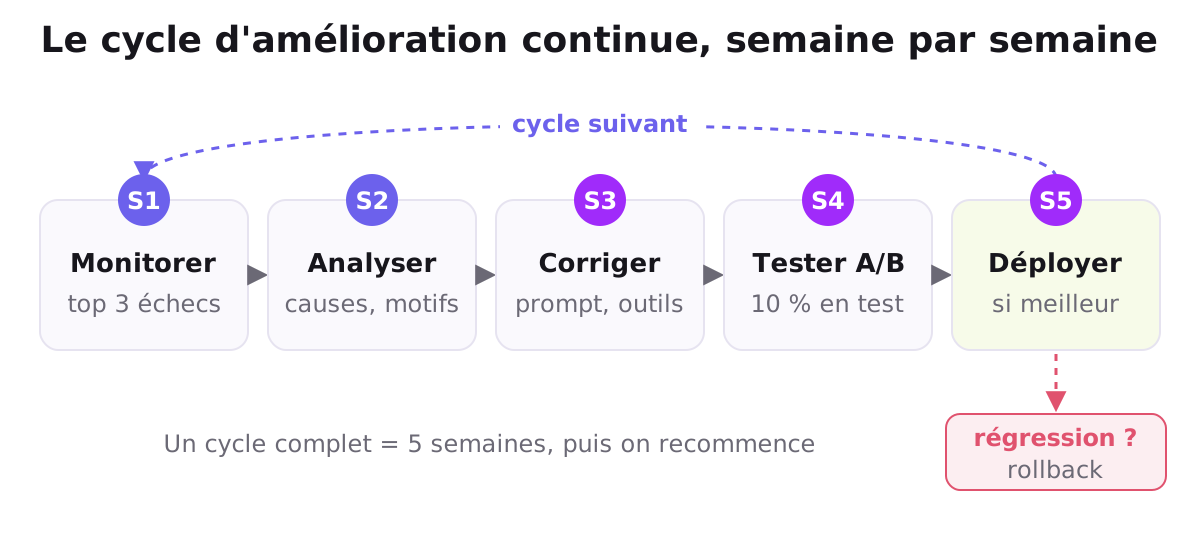
Continuous improvement cycle
Week 1 : Monitor
  - Identify top 3 failure modes
  - Collect user feedback

Week 2 : Analyze
  - Why are these failing ?
  - Common patterns ?

Week 3 : Update
  - Refine agent prompt
  - Update tool definitions
  - Deploy to staging

Week 4 : A/B test
  - New version vs old
  - Measure impact

Week 5 : Rollout
  - If better : migrate to prod
  - If worse : rollback + iterate
Monitoring dashboard (sample queries)
-- Daily success rate
SELECT
  DATE(created_at) as date,
  agent_id,
  100 * COUNT(CASE WHEN status='success' THEN 1 END) / COUNT(*) as success_pct
FROM agent_logs
GROUP BY DATE(created_at), agent_id;

-- Slowest tools
SELECT
  tool_name,
  AVG(duration_ms) as avg_latency,
  MAX(duration_ms) as max_latency,
  COUNT(*) as calls
FROM agent_logs, jsonb_array_elements(tool_calls) as tool
GROUP BY tool_name
ORDER BY avg_latency DESC;

-- User satisfaction by agent
SELECT
  agent_id,
  AVG(user_rating) as avg_rating,
  COUNT(user_rating) as rated_count
FROM agent_logs
WHERE user_rating IS NOT NULL
GROUP BY agent_id;
Checklist : Agent monitoring en place ?
- [ ] Logging to database (Supabase or equivalent)
- [ ] Metrics dashboard (Google Sheets, Metabase, or homemade)
- [ ] Alerts configured (Slack notification for errors)
- [ ] User feedback mechanism (surveys post-interaction)
- [ ] Human review process (for escalations)
- [ ] Weekly review cadence (analyze trends)
- [ ] A/B testing framework (for prompt improvements)
- [ ] Incident response playbook (if agent goes bad)
À lire ensuite : Bloc 5 : Organisations à l'ère de l'IA — Réorganisation et stratégie long-terme
: la modale et son overlay sont volontairement HORS de .tutoriel-container (ci-dessous) pour ne jamais être capturés par le split de contenu de tutoriel-gating.js, qui vide et reconstruit innerHTML de part et d'autre du marqueur — sinon la modale se retrouvait imbriquée dans .tutoriel-gated (donc cachée avec lui) et devenait impossible à afficher. -->Voir tout le parcours du tutoriel →

Une question sur cet article ?
Le jumeau numérique de Youssef te répond en direct — il connaît la méthode et peut t'expliquer autrement.
Envie d'aller plus loin avec l'IA ?
Nos formations sont live, pratiques et certifiantes — appliquées à ton métier.
Voir les formations